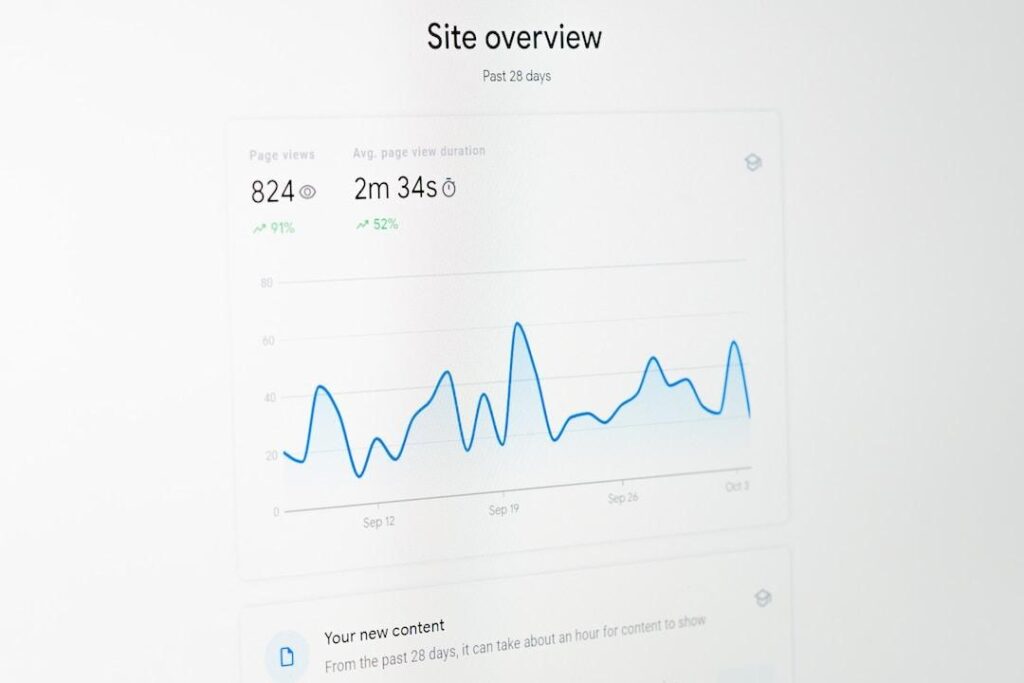
Business decisions are often swamped by massive amounts of data. The ability to sift through this data and extract meaningful insights is what separates successful businesses from the rest. To make sense of this data, many businesses employ graphical presentations such as an area chart. An area chart is a type of chart that represents the variation of a quantity over time. This powerful tool allows businesses to observe trends, compare different data sets, and make informed decisions. In this article, we will delve deep into the world of area charts, how they can improve your decision-making process, and ultimately help navigate your business landscape.
Understanding the Basics of an Area Chart
The primary strength of an area chart lies in its simplicity. This type of chart uses different shades or colors in the areas between the line segments and the x-axis to represent the magnitude of the values in question. The simplicity of the area chart makes it a fantastic tool for representing time-series data. Most businesses regularly deal with time-series data, whether sales data, product performance data, or customer behavior data.

Another distinct advantage of the area chart is its ability to display multiple data sets on the same chart, allowing for a direct comparison. For instance, a business can track the performance of different product categories over the same period, making it easier to spot trends and patterns. Such visual information often triggers valuable insights that could significantly impact strategic planning and decision-making.
Streamlining Decision-Making With Area Charts
An area chart is not just a graphical presentation of data; it is a strategic tool for making business decisions. Every shade or color on the chart represents a stream of data over a specific period. By observing this data, a decision-maker can easily identify trends, patterns, and potential anomalies. For instance, if the area chart shows a continuous upward trend in sales, the decision might be to ramp up production to meet the increased demand.
This tool is notably effective in strategic planning, especially when comparing the performance of different products or departments. By overlaying multiple data sets on the chart, one can visually extract performance indicators and make comparative analyses, which form the basis of any strategic decision.
Beyond Presentation: Area Charts as Analytical Tools
Area charts serve as more than just presentation tools; they are also analytical instruments. Their power as analytical tools stems from their ability to filter noise and highlight important data trends. This feature is especially useful when dealing with large data sets with multiple variables. While the raw data might appear chaotic and confusing, an area chart can help highlight the underlying trends and patterns, aiding in problem identification and solution formulation.

As part of a larger business intelligence and analytics ecosystem, area charts contribute greatly to the data-driven decision-making process. They help convert complex, unprocessed data into meaningful information, allowing businesses to make informed decisions based on tangible insights. By understanding these data properly, businesses can identify opportunities, mitigate risks, and optimize operations.
Embedding Area Charts in Your Business Culture
For businesses to reap maximum benefits from the use of area charts, it shouldn’t just be an occasional tool used by the data analysts alone. It should be a part of the business culture, with all departments understanding how to read and interpret these charts. This understanding allows for faster decision-making and aligns everyone in the organization toward the same goals.
Training and frequent use can foster this culture. Regularly include area charts in presentations and discussions, encouraging the team to ask questions and offer insights. This practice will enhance collective understanding and utilization.
Altogether, area charts represent a vital tool in businesses’ strategic arsenal. Effective use of these charts can highlight potential opportunities, track performance, identify anomalies and give your decision-making processes a significant edge.
